
Bridgewater's Early Quantitative Model
A look into the early foundations of Ray Dalio's Bridgewater...

A while back, I was reading Ray Dalio's "Life and Principles" when I stumbled across a PDF on page 106 in the app. The PDF was a research paper from Bridgewater, and it was, to put it simply, a method of predicting FED action regarding the federal funds rate.
Here is a link to the full paper https://imgur.com/gallery/yXseiSs
Basically, the model looks at four broad categories:
Money and Credit
Economic Growth
Inflation
Historical FED policy
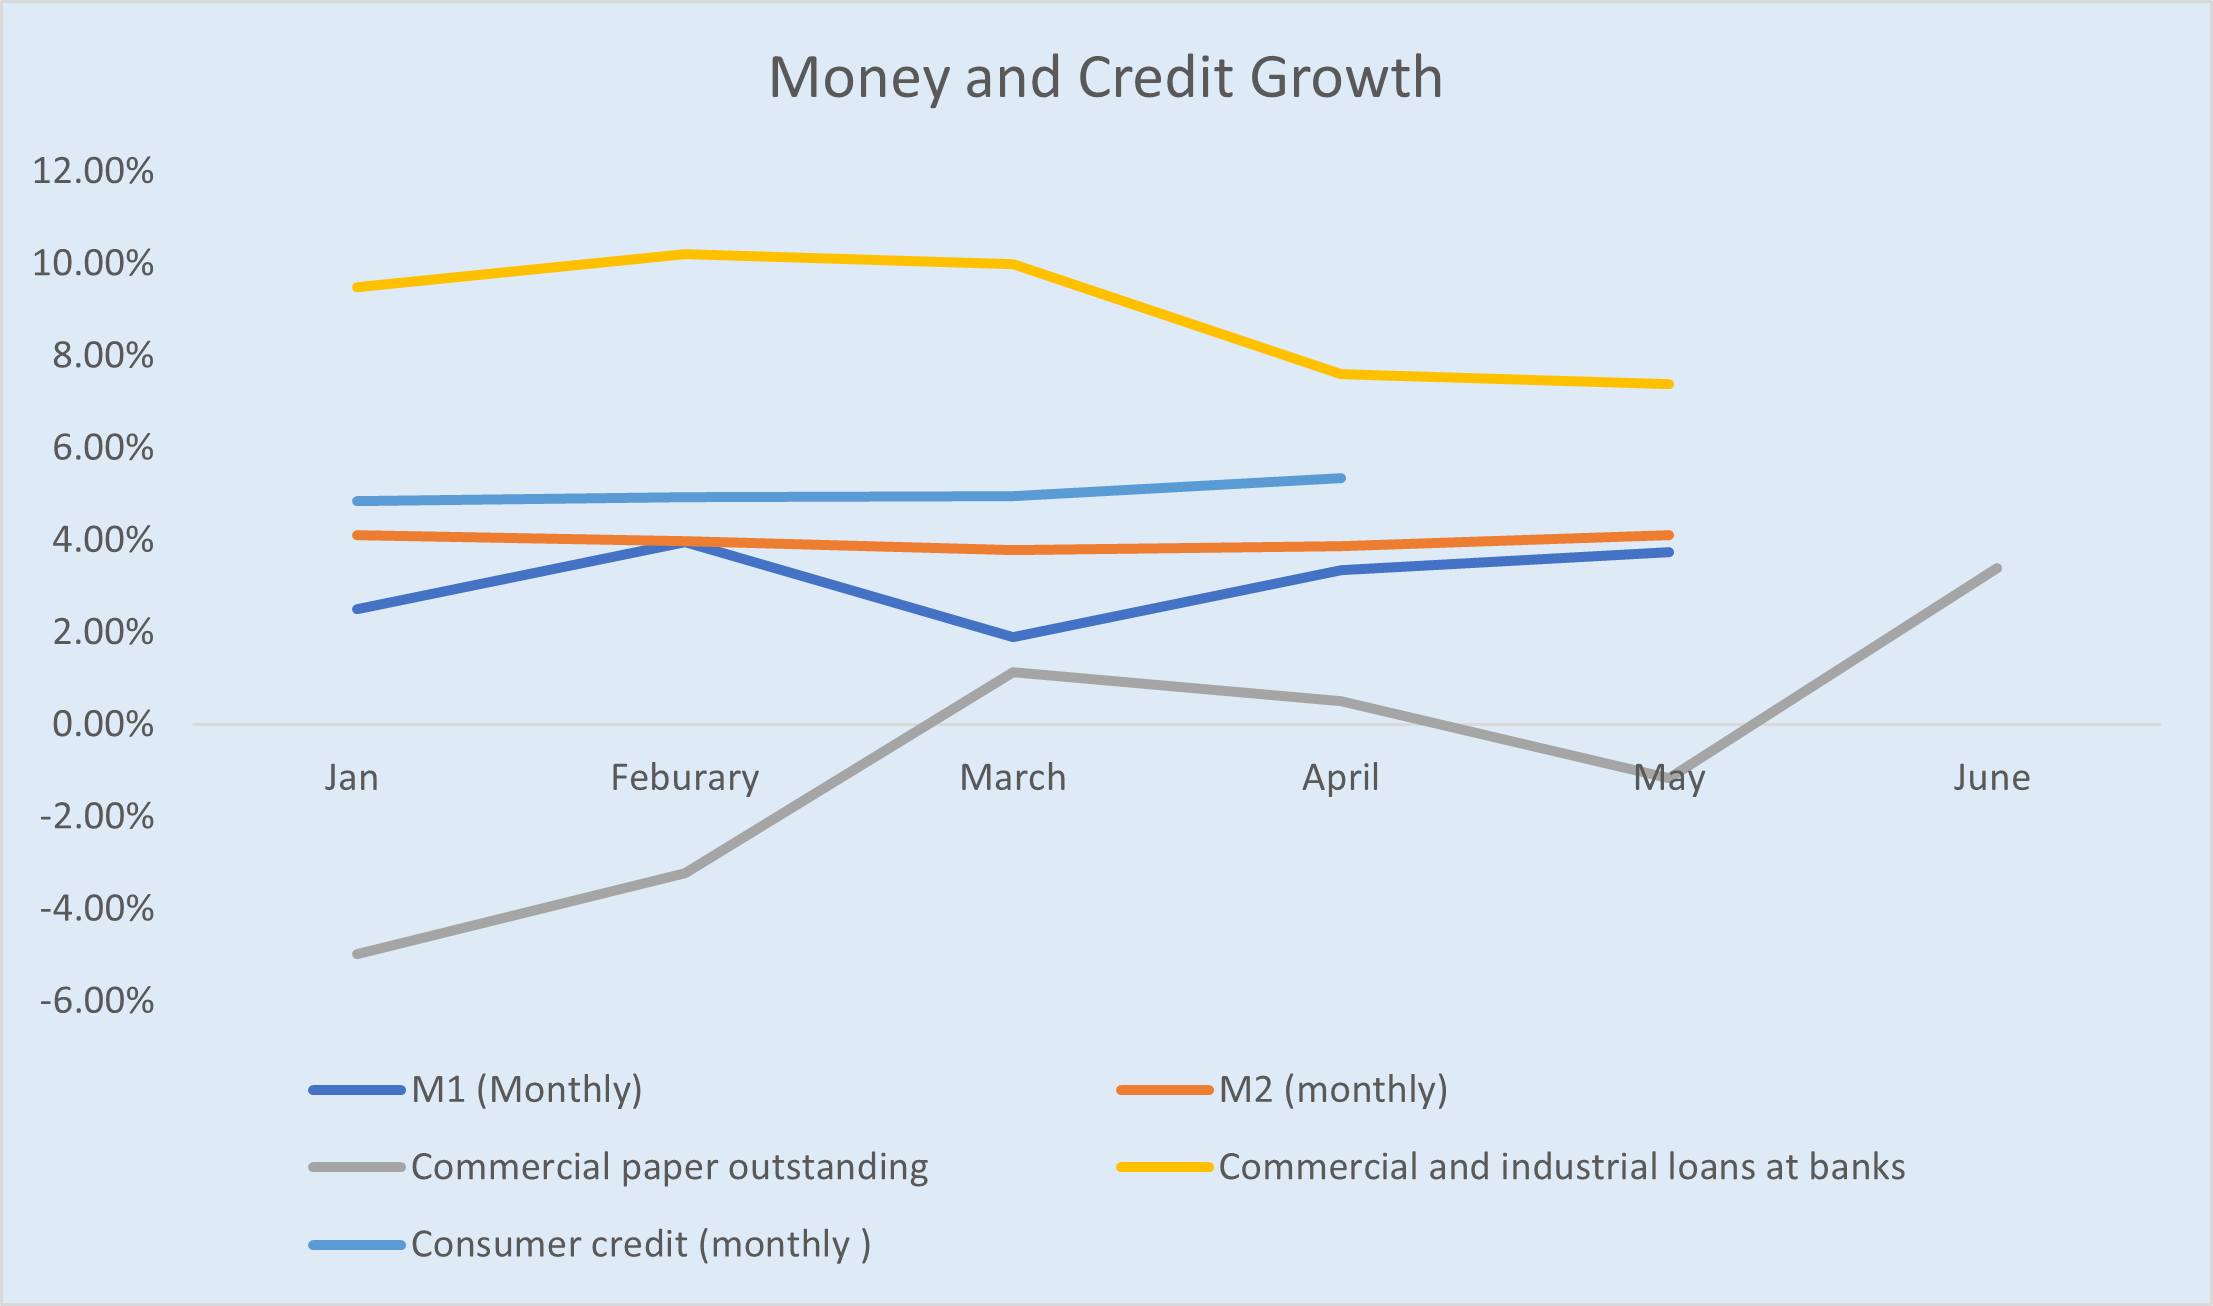
To explain this system a bit further, the paper enumerates which quantitative measures it uses specifically to obtain Bridgewater’s signal values. For example, the money and credit category includes data such as:
M1
M2
Commercial paper outstanding
Commercial and industrial loans at banks
Consumer credit
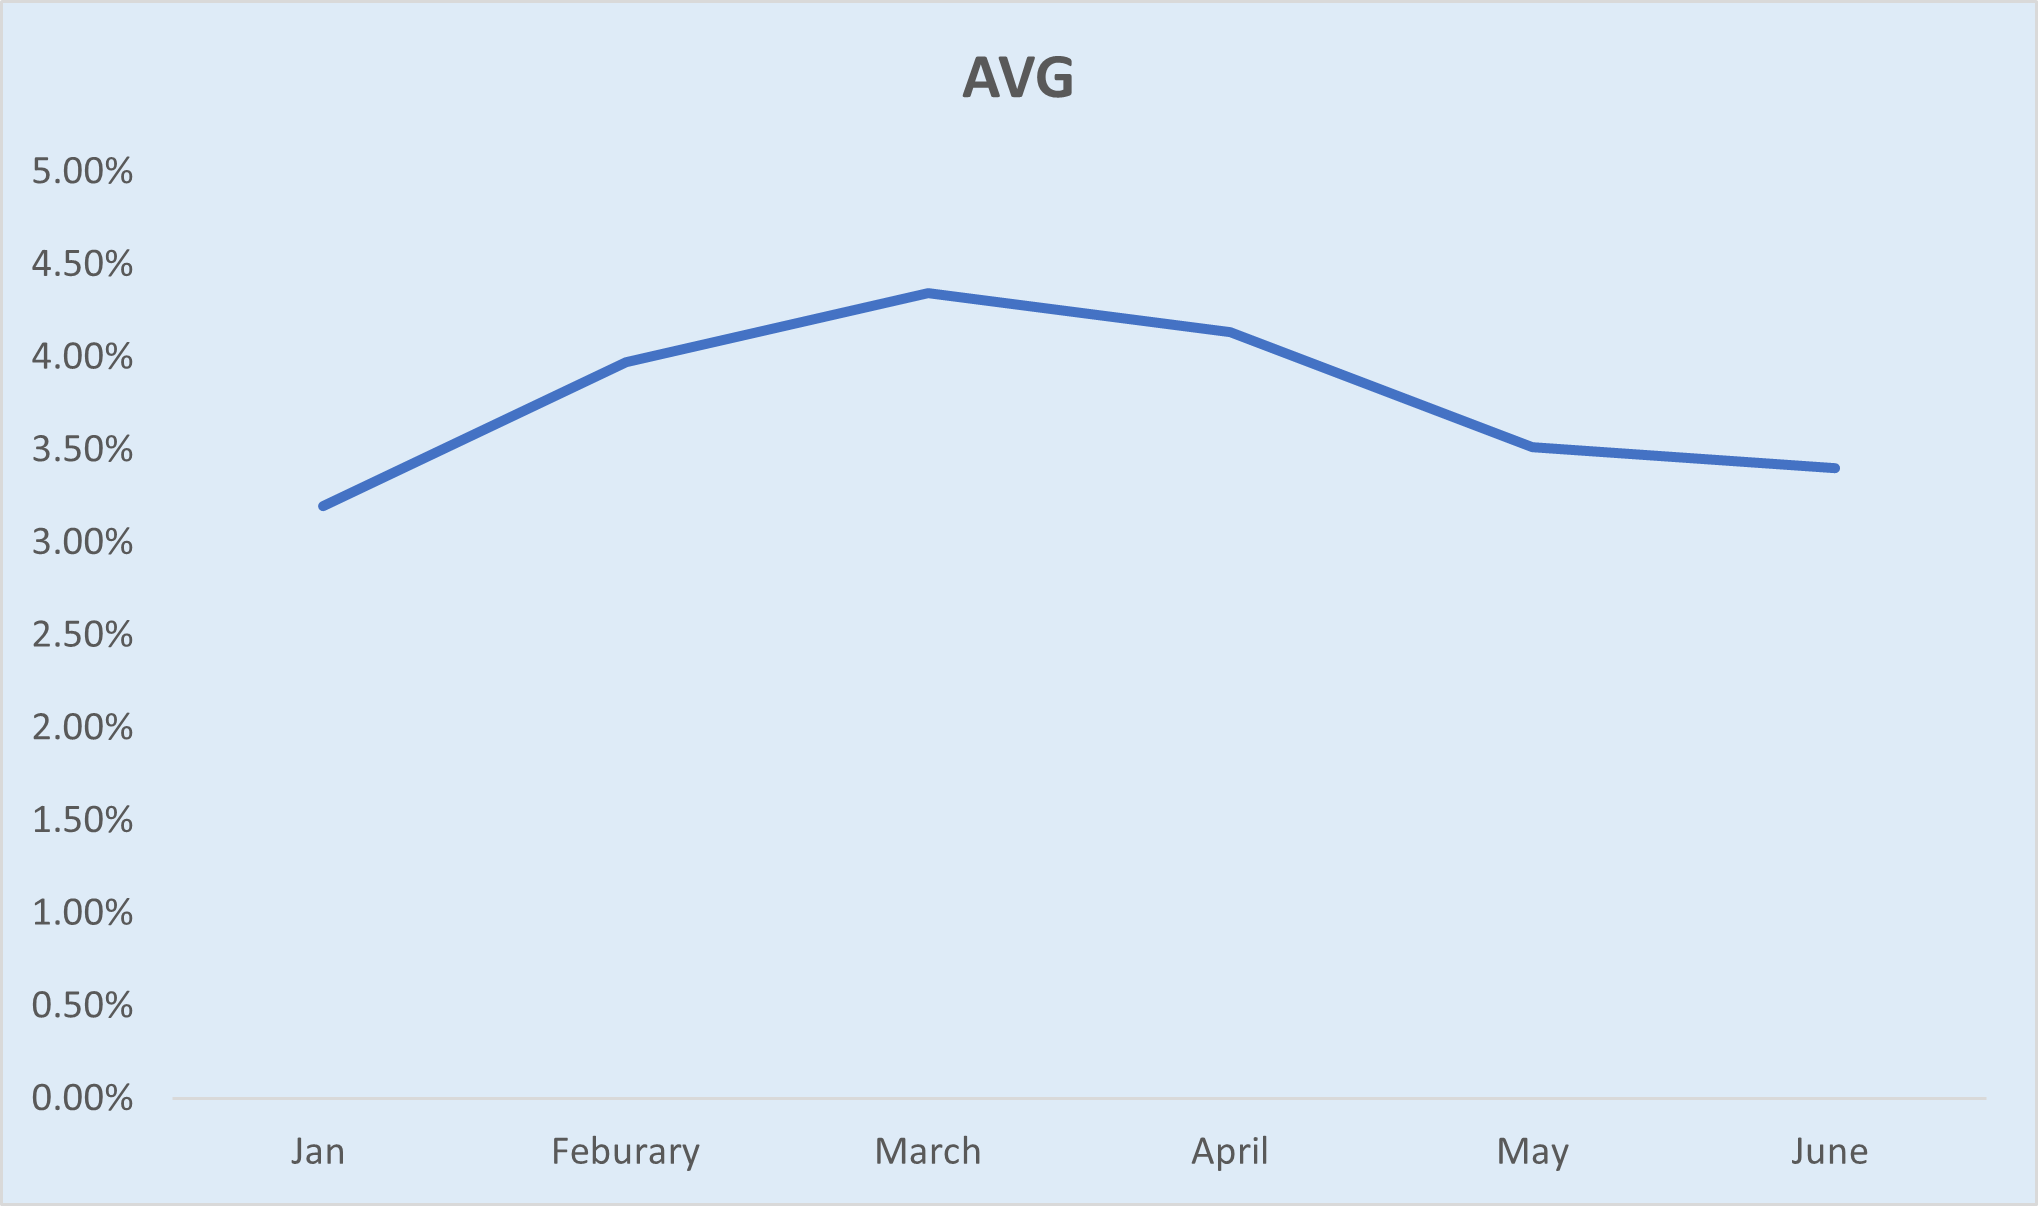
Then taking these values and calculating the percent change year over year allows one to take an average of all of those percent changes to compare to Bridgewater’s signal values.
Ideally, you would want the data points for all of these figures, however as mentioned in the paper, one of the main problems with this quantitative model is that there are some lagging or discontinued indicators so I made the most of the figures that I did have and took an average of the data points present.
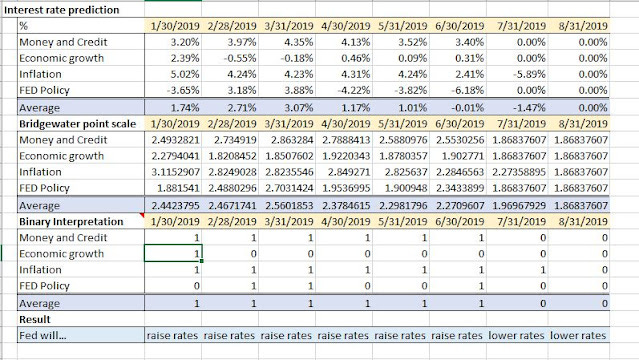
Using a bit of math, I was able to find the formula that Bridgewater used in order to translate the average data into their signal values. Using the values of (1%,2) and (14%,9) I was able to find a formula that follows closely with the translation on the paper, although not 100% carbon copy I’m guessing.
Then doing this exercise for all other categories, taking the average of all of the signal values gives one the final figure to predict interest rate action. Basically, through backtesting, Bridgewater determined that if the cumulative signal was above 2.3 the FED would raise interest rates and vice versa.
The main issue with this quantitative model (this is pointed out in the research paper also) is that it assumes that a "wise" Fed chairman is holding the reigns. What this means is ambiguous and up to one’s judgment, so this model is more of a “quantitative-driven” model. In addition to this, the backtesting for this model was done when Bridgewater was just starting so one would have to conduct backtests from then to the present time to verify that the 2.3 indicator is correct. That being said, I was able to predict the rate easing in July of 2019 so maybe this model has some merit after all.
I was able to upload my work to google drive as well for you guys to look at the calculations yourselves, have fun!
https://docs.google.com/spreadsheets/d/1_sJtIwZqp-Z-fkQmUIS4qx2kF2vL9mI1rwvs4CPbomg/edit?usp=sharing